By Jimi Barkway · Published 1 September 2026 · Updated 3 September 2026 · Part of the honest manual
The short version
At small numbers most metrics are noise. A conversion rate on eleven clicks is an anecdote wearing a percentage sign. Track counts instead of percentages. Borrow the published benchmarks to calibrate what normal looks like. And ask the one question the category avoids: how much of this revenue would have arrived anyway?
Your dashboard will happily compute a conversion rate on eleven clicks. It'll show you 18.2% this month and 0% next month. Both to a decimal place, both meaningless. Software reports whatever the arithmetic produces. Deciding what the arithmetic means at your size is your job. This module is that job.
Small numbers don't make rates
Two sales from eleven clicks is not "an 18% conversion rate". It's two sales. Next month's zero from fourteen clicks looks like a collapse. That is what small samples do. Any percentage computed on double digits will jerk you around. Month to month, if you let it.
Until your referral counts are comfortably in the hundreds, read these instead.
- Absolute counts. Three referrals is three referrals. It doesn't pretend to be a trend.
- Time to first action. How long between a partner joining and their first click? Shortening that gap is module 5's whole job, and you can measure it at any sample size.
- Repeats. One referral is luck. The same partner producing in three different months is a pattern. Patterns are what you're actually looking for.
What normal looks like (borrowed honestly)
You don't have enough data to know what's normal. So borrow from someone who does. The largest published dataset in this category is FirstPromoter's, from July 2026. It covers 31.4 million referrals from 12.4 million affiliates across 3,425 subscription programs. It was published in July 2026 by one of the category's tracking platforms. Every figure below was re-checked against the live study on 3 September 2026. The payback article works out the month the program covers its own cost.
- 15% of approved affiliates in the median program ever produce a referral. 6.4% produce a paying customer.
- 58.5% of referred revenue in the median program comes from the top 10% of affiliates.
- 2.55% of gross commission value gets clawed back after refunds and cancellations.
- 4% of referrals get flagged for review, and 96% of those flags are paid-ad traffic.
Sit with what those numbers do to your expectations. Ten affiliates and one producer is the median program in the data. Nothing is broken. A couple of partners making most of the revenue is how this whole category is shaped. A small share of commissions coming back after refunds is normal. Budget for it. Move on.
Averages come with the same warning as module 1's. They're calibration, not targets. Their job is to stop you panicking at normal. And to make you properly curious when your numbers sit far from them in either direction.
The question the category avoids: would this revenue have arrived anyway?
Attribution is the job of deciding which partner gets credited for a sale. It answers "which link touched this customer last". It does not answer "did this link cause the sale". The gap between those two questions is where affiliate budgets quietly leak. No vendor's dashboard is keen to show it. An honest answer makes the reported number smaller.
The classic version: a customer is mid-checkout on your site. They open a tab and search "your-brand coupon". They click a coupon page, come back, and buy. Attribution hands that sale to the coupon affiliate. The customer was already buying. You paid a commission on demand that existed. That is exactly why module 2 told you to take a written position on coupon sites before this happens.
You can smell non-incremental revenue in data you already have.
- Minutes, not days. A referral whose click-to-purchase gap is three minutes was probably already converting. Content-driven referrals take days or weeks.
- Your own brand, resold to you. Referral spikes that track your product launches and brand searches, rather than the affiliate's own publishing schedule.
- Identical churn. Genuinely referred customers usually retain at least as well as organic ones. They arrived pre-sold by someone they trust. An affiliate whose customers churn no differently from a cold ad click isn't adding trust to the sale.
At founder scale you can even test it, crudely but usefully. Keep asking new customers how they heard about you. Compare the answers against attribution. Or pause a suspect coupon partner for a month and watch whether total revenue actually dips. It usually doesn't. That's your answer.
Make the software show its working
Whatever tool you use, two things separate numbers you can trust from numbers you can only repeat. First, reports you can cut by affiliate, and by country, campaign and time. With refunds taken off. Then you're looking at kept revenue, not gross bravado. Ours includes a Direct row, so the affiliate total visibly adds up against everything else.
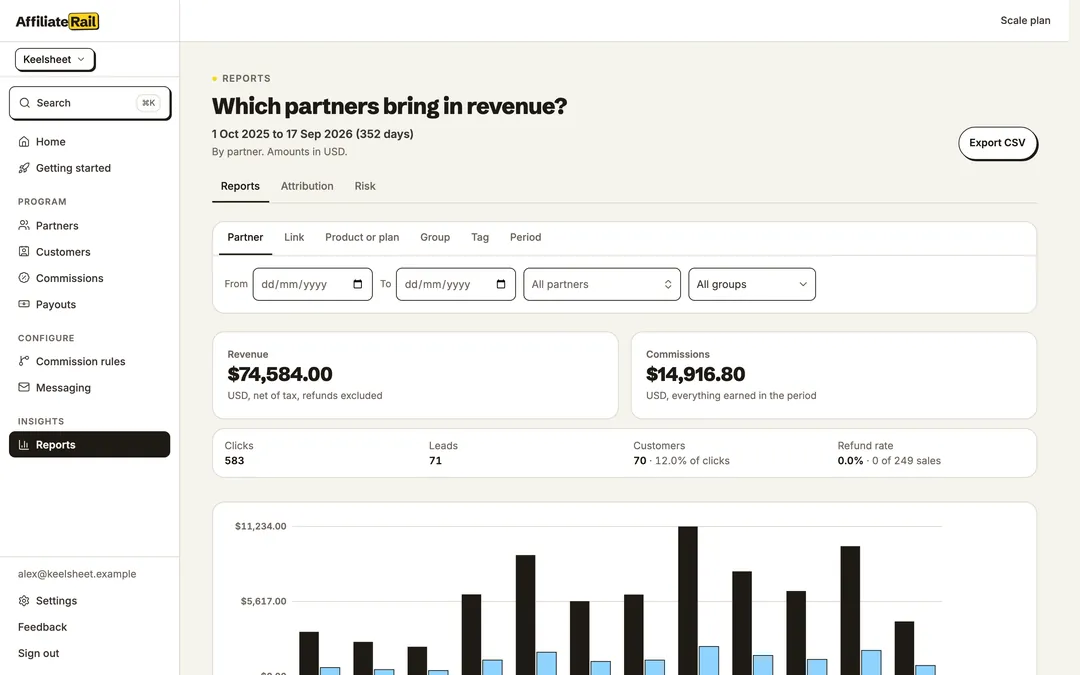
Second, a reason on every commission. Each one in our system carries a plain-English trace of why it exists. Which rule matched, which branch fired, what the customer paid, why the amount is what it is. When a partner asks "why was this $12 and not $19", you read the trace. No archaeology.

The three numbers worth a standing check
Everything above compresses into three numbers you'll check monthly for as long as the program runs.
- Producing partners: how many affiliates generated anything at all this month.
- Kept referred revenue: referred revenue net of refunds, the only version of the number that's real.
- 90-day retention of referred customers, next to the same figure for everyone else. This is the single best incrementality signal you can get for free.
What do founders ask about the numbers?
Why should I not trust my conversion rate yet?
Two sales from eleven clicks is not an 18% conversion rate. It is two sales. Until referral counts are comfortably in the hundreds, read something else. Absolute counts, time to first action, and repeats.
What does a normal program look like?
In FirstPromoter's July 2026 dataset, 15% of approved affiliates in the median program ever produce a referral. 6.4% produce a paying customer. 58.5% of referred revenue comes from the top 10% of affiliates. And 2.55% of gross commission value is clawed back after refunds and cancellations.
Which three numbers should I check every month?
Producing partners. Kept referred revenue, net of refunds. And 90-day retention of referred customers, next to the same figure for everyone else.
Those three come back in module 8 as the whole of the monthly check. Before that, module 7. What to do when the numbers are wrong on purpose, because someone is making them that way.
Where these facts come from
Every figure above was read off the document named here on the date beside it. If one has moved on, email support@affiliaterail.com and we will correct the figure and move the date.
- FirstPromoter's July 2026 referral dataset: 31.4 million referrals across 3,425 subscription programschecked 3 September 2026
- Commission rules guide: the trace on every commissionchecked 8 September 2026
No card. Cancel in one click.